Categories
Blog

Converged & hyper-converged infrastructure

(Hyper-)Converged Infrastructure has become an established technology in the last few years, with a mix of startups, established vendors and some surprising entrants offering systems.

Converged infrastructure may combine infrastructure components like servers, storage, networking and software components into a unified solution. Software components will generally include a virtualisation component like VMware, KVM or Hyper-V and can include other features for management, data handling, automation, orchestration and cloud connectivity.

Two popular converged infrastructure vendors include VCE and NetApp. VCE – originally a joint venture between VMware, Cisco and EMC (with Cisco now only holding a minority interest) –  consists of Cisco networking and storage networking components, Cisco UCS servers and select options of EMC storage from VNX and VMAX to XtremIO  has the distinction of the direct involvement of VMware providing the virtualisation component. VMware itself has released a reference architecture with their VMware EVO:Rail  and EVO:Rack, which allows other vendors to create hyper-converged systems based on VMware’s design. NetApp offers a similar design to VCE’s converged systems with the FlexPod architecture. The main difference with NetApp’s solution is that it replaces the EMC storage component with NetApp storage.

The advantage of these converged environments is three-fold:

  1. Vendors provide an extra management layer on top of the converged system simplifying overall management of the environment
  2. Vendors perform additional testing and can provide improved update management (e.g. for firmware)
  3. The components of converged infrastructure can work independently on their own, e.g. servers or storage can be used for other purposes outside the converged infrastructure.

The 3rd point is the main differentiator to hyper-converged infrastructure, as hyper-converged systems are generally much tighter coupled. Several hyper-converged “servers” come as a 2U rack unit, which will converge processing, memory, networking and storage in this unit. From there hyper-converged systems may scale out to a number of nodes.

HP is just one of the established companies selling a hyper converged system. Readily available in Australia and by now established hyper-converged vendors are Nutanix and SimpiVity.  The disadvantage of hyper converged infrastructure can be a lack in flexibility.

Convergence does not stop here, but includes specialised vendors like Teradata (data warehouse), specialised solutions for databases by Oracle, specialised software to turn existing server hardware into converged infrastructure (e.g. Atlantis USX) and reference architectures for convergence (EMC VSPEX).

Overall the wide range of offerings provides flexibility for companies to select the solution that is fit for purpose. Regardless what the requirements are – be it ease of management, reduced cost, improved reliability – there will be an infrastructure solution that will fit selected criteria; although there will rarely be an “one-fits-all”.

Categories
Blog

Infrastructure Orchestration – It’s not just another magic app

Infrastructure orchestration can be a transformative influence within IT that delivers an elevated rate of improvement, increases agility and enables faster business iteration. The question is how can such value from orchestration be realised?

Delivering effective cloud orchestration is, at its core, a software development problem and needs to be treated as such and invested in using software development lifecycle management (SDLC) methods and tools. Software development is an ongoing and evolutionary process.

The cost of entry is typically high, (licensing, consulting, designing, building, test, operation) which may require a longer period for returns to be realised.

A private cloud orchestration solution is best described as a journey rather than a destination. The solution needs to exist as an entity that operates outside the regular three or five-year equipment lease cycle if it is to succeed since it is a new software development environment that can represent significant investment for the business and doesn’t deliver benefits when deployed as a point solution for a new infrastructure stack.


Approach to Orchestration

An infrastructure orchestration solution is a software development framework. It is a toolbox that allows administrators to define rules about how change is implemented in software defined infrastructure and how that change moves through the infrastructure. By its very nature (a software stack managing other software stacks) orchestration requires a software development lifecycle (SDLC) to be successful.

There is a risk around which SDLC is selected for use with the orchestration solution. A business may not have any software engineering capabilities or may already employ an SDLC that aligns well with the business objectives and is well understood by staff. That same SDLC may not be a good fit for an orchestration project because the existing SDLC may be geared to produce a different outcome for the business, especially considering that orchestration is introducing software development requirements to physical infrastructure teams. Infrastructure teams may not even be aware of what SDLC is used by the organisation or if an SDLC exists at all.

The correct SDLC selection is important because it provides the rulebook about how software is created and curated.

The selected SDLC will require investment from the business to make the SDLC operate effectively and deliver business outcomes. Specific areas of cost include governance, tooling and people.

  • Governance provides the SDLC management framework. It covers the rules and activities performed by people by which the software is developed, delivered and tested.
  • Tooling includes the tools required to develop the code and also the supporting software and hardware to allow the development to occur and receive suitable testing. An additional cost for tooling extends to the supporting reporting and tracking tools that developers typically need to track and address issues as part of an SDLC.
  • People are a significant cost for any SDLC as is the time required to accommodate the changes that SDLC brings to a team. For smaller teams it may be valid for team members to fill multiple roles; however as the requirements and agility scale upwards it can become necessary to employ more people to fill the roles as the workload increases, particularly when a fast development cycle is desired.

Platform Costs
The upfront costs for an orchestration platform includes elements such as, licensing, consulting/design, build, test and operation. Each of these areas has their own discrete cost items to consider.

  • Licensing costs will vary depending on the selected solution and the domains selected for the orchestration solution to manage.
  • Consulting and design costs will be a function of available skills within the organisation and the time available to internal staff to invest in the orchestration solution.
  • Build costs include not only time to deploy the tool as per the design but also any additional infrastructure that is required to operate and provide the orchestration solution.
  • Test costs for an orchestration solution are potentially very large depending on the level of complexity and isolation required for testing. Most organisations will not accept the risk of performing test activities in or near production environments. This then introduces a requirement for one or more isolated test environments and the additional physical or virtual infrastructure these require.
  • The ongoing operation of the orchestration tool may also represent considerable cost in terms of license maintenance fees, ingestion of change and upgrades, scaling and performance considerations and integration with Operational Support Systems and Business Support Systems.

An additional cost risk is if multiple orchestration platforms are deployed within an organisation. The previously mentioned costs around SDLC and platform costs are potentially doubled for each orchestration platform. Complexity and conflict may also emerge if those duplicated platforms are lifecycle managed using different methods. In an even worse scenario the same infrastructure elements may be managed by conflicting orchestration solutions.

Selecting the right single orchestration platform that delivers the required business outcomes, and selecting the platform that has the strongest flexibility and interoperability is critical to success.

An orchestration solution that is a point solution for a new infrastructure silo does not mitigate these risks. An orchestration solution that can exist outside the infrastructure silos as they come and go within an IT organisations infrastructure lease cycles will deliver a more comprehensive and cost effective outcome for the business.

Categories
Blog

Sydney Puppet Camp

Diaxion is proud to be a sponsor at the up coming Puppet Camp Sydney.

Details:
May 3 2016
66 Goulburn St
Sydney

Look forward to seeing you there.

Register today!

Categories
Blog

Plan your migration off unsupported servers

If you are not running Windows Server 2012 R2 and SQL Server 2014 yet, it’s time to consider upgrading to take advantage of groundbreaking improvements in performance. Support has either ended or will end soon for the following products, which means no more security updates, increased maintenance costs, and potential compliance concerns.

Talk to Diaxion about our efficient and proven top down (business lead) approach to allocating the assets to a remediation path that is agreed with the business to aims to get you traction quickly

Have Microsoft Consulting credits or a Custom Support Agreement, can we help you utilise them to remediate your end of support assets?

There is tremendous value available in upgrading to the latest version of SQL Server including

  • – Significantly improved performance. Benchmarks show SQL Server 2014 performs 13x faster than SQL Server 2005 and 5.5x faster than SQL Server 2008.
  • – Additional performance gains from in-memory technologies for OLTP, data warehousing, and analytics
  • – Simplified updating and maintenance as well as more online processes
  • – Easier than ever high-availability

We’d like to set up time with you to start planning a transition that will provide you with the security features and reliability you’ve experienced over the last decade with SQL Server 2005, plus the added value of the features now included in SQL Server 2014. You also have the opportunity to migrate entirely to the cloud with Azure SQL Database or to implement a hybrid cloud with SQL Server 2014 and Azure.

To learn more, call or email us sales@diaxion.com. We can share success stories, and guide you through the next steps for a smooth transition for your organisation

Categories
Blog

Visualisation

Visualisation makes big data usable. People are inherently visual and using effective visualisation engages the pattern matching capabilities of our brain to take in information more quickly. There are a large number of organisation who have tools to help but the growth areas are in open source and start-ups. People with ‘R’ skills are in demand for this work. Visualisation leads to insight but action is then required from the insight otherwise this is trivia.

This article is a follow on to my previous article on big data <- (convert this to link), please read this to get an understanding of some of the background to this article (thought you don’t have to). This a brief introduction to visualisation to give a quick sense of what it is about and why it is important (including biological factors!). It will cover the importance and business of visualisation, typical uses and finally some of the players in the space. Visualisation and Big Data Data visualisation is hot - there is a never ending list of companies that have software or want to help you with visualisation and there are online courses available to help you gain the skills and knowledge. So why is visualisation hot? Two words - Big Data, these two words strike fear and/or excitement into people depending on their perspective. Excitement from the people that want to use big data and fear from those who may be tasked with implementing and managing! Big Data may be the underlying cause but the real impact of visualisation is, it makes sense on the data that you have. Being able to process and refine large amounts of information through Big Data techniques is all well and good but, unless you have tools and techniques to take that data and present the results in a form that is intelligible to your audience and beyond, it is just columns and rows of data (and pretty uninteresting). Business are relying more on big data for decision making but the visualisation is what provides the insight. Inherently most of have some sort of response to visual input, one only has to look at the effort film makers, TV, marketers etc. put into the visual image to understand the importance. Images significantly aid understanding and retention of information as well as providing a sense of comprehension that either takes many words or cannot be expressed in full through words. Our visual system is built and tuned for visual analysis, we take in a lot of information via our eyes and our brains are then very good at pattern matching, edge detection and shape recognition. Pattern matching is important as much information is carried in the pattern or the pattern breaks e.g. outliers, this gives us meaning. To illustrate the importance of visualising the data, I will use the classic Anscombe’s quartet. The data that produces each graph below has the same mean, variance, correlation for each axis and linear regression but as you can see produces a remarkably different graph!
v2

Would you get the above information from this?
v1

So delivering information quickly and succinctly requires the use of visuals which in turn leads to actionable information or insight. Something can be done about the pattern or outlier. In business this can be a competitive advantage through being able to take action more quickly if the information can be presented in the ‘right’ way. Of course the ‘right’ way requires experience, skills and knowledge rather than a ’tool’.

What is Visualisation being used for?

One could say everything and this is partly true but I am going to concentrate on the main uses either and those relevant to the audience for this piece. Some of the main uses of visualisation have been in healthcare and allied areas such as pharmaceutical research, health science, genomics etc. Other key areas have been in sales especially clickstream analysis for large (and not so large) ecommerce sites, customer satisfaction usually collecting data from online and contact centres. For information technology specifically log analysis, events and correlation, security incidents and security events over time.

One of the issues impacting organisations with monitoring type data, is the ever larger firehose of data being thrust towards the analyst of the data. This is akin to the issues that air forces (and aircraft manufacturers and airlines) around the world are having to deal in pilot overload. They are trying to deal with the information flow so that pilots are not overwhelmed with information and then cannot act on it. In combat situations, this the difference between living or dying! Visualisation is the only approach currently that scales, to deal with the increased flow of data. Our pattern recognition capabilities help us make sense of the data with hits and tips from the software.

Using the visualisation can be the hard part. Taking the information contained within the visualisation, making sense of what is seen, identifying the insight and then taking action is part of the human process that needs training and taking the ‘right’ action. However, not taking any action will be worse that not taking some action – Insights from analytics for which you take no action are just trivia! Once action has been taken then collect new data and see if change has occurred in the way you expected – report the cycle.
v3

So who are the players in this field

First lets tools at the tools and the companies behind them. As you might expect with visualisation coming from an academic background a number of the tools in use are open source but there are a companies now providing support for these tools as well as software companies who can sell (at time very expensive) software. The biggest development in this area has been the proliferation of web based tools often with a free tier available for limited or ad supported use.

Probably the most talked about tool is ‘R’. This is an open source statistical language with excellent graphing capabilities. It has a large eco-system of additional libraries that provide significant enhancement to the base tool. As it is open source and a collaborative development effort some the usability is compromised and it has a steep learning curve to get the best out of the tool. R has its own IDE as well as integrating with others via plugins and via additional plugins, integrate with code management tools. This can be important when dashboards and data sources become confused and extract after extract is created, obscuring (and changing) the source data.

SAS is the venerable closed source tool with a long history in this area. The company has been scrambling to find more relevance in this particular market area (notwithstanding the many other areas it does very successful business). SAS have released libraries to support the R language. SAS like R has a steep learning curve to get the best out of the tool. SAS will use its own data stores as well as connect to a multitude of other sources.

Tableau Software has made huge strides in this space with its general ease of use and accessibility for non data scientists. Its growth has exploded over rivals like Oracle BI Suite and IBM Cognos due to pricing, value delivery and better visualisation capability. It does tend to excel in delivering interactive dashboards. It has become an issue for IT departments with many business units buying copies and effectively paying more than having managed purchases as well as under used licences.

Splunk is both visualisation and data processing engine. It is probably better at the processing, correlating and indexing of data than the visualisation side but is with including here. The tool is focussed on processing machine generated data such as logs of many types and can be done in ‘real time’. Many security teams have implemented Splunk for security log and incident analysis and the tool has been very successful in this area. More recently Splunk, the company, has been trying to broaden the appeal of Splunk outside this fairly narrow area into more diverse big data and visualisation functions. I am not sure how successful this will be due the fairly ‘techie’ nature of the tool.

Tibco Spotfire is another complex tool but is seen to be easier to learn than SAS. Very good visualisation capabilities. It has a hybrid in-memory and in-database data store and very powerful processing capability on top of this for analysis and visualisation. Similar in power to SAS and easier to understand but not necessarily less complex.

Pentaho is open core software – having both an open source edition and a paid enterprise version with extra features and support. The software provides a layer to interface to a very wide range of Big Data and traditional data sources. Pentaho provides in-memory analytics and visualisation capabilities as well as sourcing data from a number of backends. The overall platform provides a workflow like processing view from data to analytics.

The rise of ‘cloud’ visualisation tools has been rapid but current these tend to be limited in function compared to the other tools above and are often geared towards producing infographics rather than true interactive visualisation – not that they do not tell a good story. Examples include Google Fusion Tables, Timeline, D3.js (a javascript library), Sisense, Nuvi – for social media data, and Silk. I am not sure many of these could comp with very large datasets except for Fusion tables.
Just as a word of caution, these tools are not the only ones available!

So we have talked about the tools, now who do I think is doing this well in a business context:
• GE – especially their power engineering. There receive telemetry data from their turbine generator installed in power stations around the world every 15 secs
• GE and Rolls Royce – aircraft engineering. Data from the engines of their engines is sent back partly during and after every flight. The information is visualised to provide engineers with information on the health of the engines
• CSIRO – have a wealth of information is genomics, spatial data and climate data, with the brains trust to pull together some great visualisation
• Hans Rosling – world health expert, created a visualisation of health over time (see link)
• National Geographic has some interesting visualisation on their web site including here
http://www.informationisbeautiful.net/ is an interactive site with some excellent examples – not all business though
• Google
• American Express
Some visualisation start-ups are trying the change the way we think about and look at data including on mobile devices. Often these are hiding complex calculation under a relatively easy to use interface. Here are a few:
http://www.ayasdi.com/ – network graphs
http://www.clearstorydata.com/ – data platform and analytics capability, focus of telling the business story
http://www.platfora.com/ – another integrated data store and analytics capability very much targeted at big data
https://www.graphiq.com/ – a little different, ‘pre’ built visualisation based on a search for a subject, try this – https://www.graphiq.com/search/search?cid=1&query=galaxy%20s5
http://www.sisense.com/ – accessing data from multiple sources and bringing it together
http://www.datameer.com/ – another platform
How Diaxion can help – our expertise in this area is in the architecture, design and setup of the infrastructure to enable the delivery of these tools and platforms. If you are interested, call us to find out more.

Below are some examples of visualisations – click the image for the original story

Simulation of measles infection rates

Links
http://blog.hubspot.com/marketing/great-data-visualization-examples
http://www.visualisingdata.com/2015/03/best-of-the-visualisation-web-february-2015/
http://www.slideshare.net/Centerline_Digital/the-importance-of-data-visualization
http://blog.visual.ly/why-is-data-visualization-so-hot/

Why Data Visualization Is Important


http://radar.oreilly.com/2012/02/why-data-visualization-matters.html
http://www.visualisingdata.com/

Categories
Blog

Microsoft Windows Azure in Australia

While the competition between enterprise grade cloud hosting platforms in Australia is rapidly on the rise it is being made increasingly difficult to know which offering is going to be best for you and your business. Now that Microsoft can offer their cloud computing platform ‘Windows Azure’ in this country as a competitive hosting environment against other industry giants such as Google Cloud, Amazon Web Services and VMware vCloud Air it is worth looking into some of the key benefits they can offer over their rivals.

Responding to the concerns of many Australian businesses and something that will appeal to customers operating in Government, financial and health care sectors amongst others, Azure offers complete sovereignty of data meaning that they can guarantee confidential client information stays stored on Australian shores. This solves many issues for organisations where previously a migration to cloud was not an option because data was hosted outside of Australia. Now, clients can move to the cloud with Azure knowing their data is kept within Australia and staying compliant with the Australian Privacy Principles (APPs).

Additionally to their security in data sovereignty, Azure, Office 365 and AWS are the only public cloud services in Australia to pass an Australian Signals Directorate (ASD) Industry Security Registered Assessors Program (IRAP) compliance assessment (Azure being the first). This provides certification that Azure has appropriate and effective security measures in place in areas such as intrusion detection, cryptography, cross domain security, network security, access control and information security risk management.

Azure is currently hosted in datacentres in two cities – Melbourne and Sydney, which of course means faster speed and latency for staff and customers knowing their data is kept close by. While AWS, Google and VMware public cloud offerings offer local city hosting, none can provide it for more than a single location in Australia. This is a fundamental difference for a business wanting to host their mission critical applications or intellectual property in the cloud. Azure has the advantage over their competition by being able to offer a Disaster Recovery or Load Balanced environment across two local cities.

They offer more than just redundant data centres for hosting servers and applications though. Azure is the leader in cloud integration with other Microsoft tools such as Active Directory, SharePoint and Office 365 so if your organisation is mostly a Microsoft shop then investing in a cloud platform that seamlessly integrates with Microsoft products makes sense. For example, Azure Active Directory allows you to extend identity and authentication into the cloud meaning users can use the same ID and password to log onto their office workstation as well as Office 365 and any other Microsoft SaaS applications.
Another feature to make life easier is Azure’s ability to build a true hybrid cloud environment. Unlike some other competitors “cloud only” approach Azure allows you to use your on-premises resources and applications to use cloud services such as the cloud database and storage services. This means that you can run the same Windows and Linux virtual machine in Azure that you use on-premises simplifying operations and migration of workloads to and from the cloud. In other private cloud environments often your VM might run on a proprietary hypervisor meaning that although migrating your workload to it will be fairly simple, moving it back can be extremely difficult and costly.

Figuring out which cloud provider is the most cost effective for your organisation is more than likely going to cause the biggest headache. It is going to be entirely dependent on how complicated a service is required. If it’s just a matter of deploying and running a few VMs then Azure is around the same mark as other big corporations and also provides the simplest costing options to achieve this. Some will offer cheaper rates to get your workload in but sting you when you want to withdraw data or terminate your service. This is not something Azure charge for. With the ever falling Australian dollar however Azure has recently had to increase its service cost in this country by 26% for new customers making it more difficult for anyone to invest in local cloud services across the board. Only time will tell if other major providers will be forced to follow suit.

When the time comes to consider which cloud platform is most suitable for your organisation Azure in Australia can offer some true strategic benefits. Many can take confidence in the fact that it is created by Microsoft – a trusted industry leader whose technology powers some of the world’s most recognisable and widely used tools. Azure Australia is growing rapidly and adds support for various features, applications and different technology platforms on a regular basis so if you are planning a migration to the cloud, it should definitely be high on your list of considerations.

Categories
Blog

Infrastructure as Code

What is the job of operations and development? Most would say development builds systems and operations makes sure the environments are reliable and efficient. This creates a dichotomy as one the biggest causes of ‘breakage’ or unreliability in environments is the introduction of change, which is what required of the development teams. The other biggest cause is human error – ‘fat finger’ syndrome or just some other small mistake that has unintended consequences. However, as you may well understand, the job of both development and operations is to enable the business to achieve its goals (and therefore keep the dev and ops teams employed).

There are a number of ways to resolve this dichotomy, most of which are complementary. This article is about a superset of some of these methods and techniques – Infrastructure as Code. So what is infrastructure as code? My definition of infrastructure as code is as follows:

“Infrastructure as code takes many of the tools, techniques and practices from software development and applies them to technology infrastructure. It incorporates automation and by explicitly defining the infrastructure as sets of instructions that can be executed by automation technology, allows the maintainability, manageability and repeatability that characterises software.”

While this is probably an oversimplification, it incorporates the key ideas in infrastructure as code, these being:

  • Automation
  • Infrastructure above the physical hardware being really treated as software (it always was)
  • Incorporate development, test, release as a cycle in infrastructure
  • Fix the code then ‘compile’ and retest rather adjust ‘live’
  • Versioning and migration paths for infrastructure

The following model illustrates where infrastructure as code operates across the overall ‘stack’.

Why has this come about? From a top down perspective, essentially the virtualisation of hardware, storage, networking and cloud along with things like containers, has moved the practice of infrastructure management from the role of cables, boxes, cards, plugs and command lines on machines to code driven automation. The cloud has been a major driver and techniques from the cloud are now being applied to existing infrastructure. The cloud providers needed a way to operate at mass scale and so developed sets of tools and API’s that gave them access what was required in a focussed way. This benefit was then passed on the customers of their services who found it easier to manage which then intern encouraged those customers to look at ways to treat their internal infrastructure in the same way. This desire has been taken on by the ‘cloud washing’ enterprise software vendors who have either bought companies to give them the capabilities to tried to adapt existing products.
From a bottom up perspective, and this is where the streams of devops and infrastructure as code, merge. The majority of seasoned operations engineers will have a set of scripts that allow them to perform sets tasks repeatedly. This led them to look for additional ways to perform changes reliably and efficiently and across multiple machines at the same time. At a similar time, many were/are dabbling with cloud for their own knowledge and or applying these techniques to the infrastructure in their own home. They found that defining the infrastructure as software based resources gave them higher flexibility and better reliability and the ability to return to previous configurations easily. This made their jobs easier and so pushed for the same or similar tools and techniques to be incorporated into their work.

This merge of top down and bottom up is creating a powerful direction in the evolution of infrastructure.

Business benefits
So if this is a direction that does not seem like stopping, there must be some business benefits to rather than just being ‘cool’. The answer to this is that is hits the majority of items business cares about when dealing with a non core part of their business – speed, customer service, cost reduction, risk management and compliance.

Customer service

  • Increase reliability of change
  • Less downtime
  • Enable delivery of overall outcomes more quickly

Speed

  • Effect change quickly
  • Take infrastructure off the critical path
  • Increase change rates

Cost reduction

  • Manage more environments with existing resources
  • Increase the amount of change for same or less cost

Risk

  • Easier testable change
  • Rollback capability

Compliance

  • Version control
  • Process driven
  • Audit trail of change

Technical benefits
So we have business benefits, what about technical benefits? Let’s put a situation together – you have a server that is not responding or unreachable. A check shows that the server has crashed, you then remember how difficult it was to configure that server with all the require software and versions. What should the order be? What versions are required? This would be a dreaded moment but with infrastructure as code this becomes a simple matter of checking out the server definition and applying it via the appropriate software.

Using infrastructure as code means writing code (duh) but doing this is in a high level descriptive language rather than cryptic command line statements (though this can be incorporated). But this also means using the software development practices such as testing, small deployments, version control, using patterns, modularity and reuse. It is not the same as infrastructure automation which is executing and replicating multiple steps over a number of machines.

Typical benefits seen include:

  • More predictable outcomes
  • Testable changes
  • Differences between versions can be easily identified
  • Process enforcement
  • Reduced incidents
  • Use of patterns
  • Modularity and reuse – with respect to the code
  • Scripts acting as documentation for your infrastructure

Limitations
Probably the biggest limitation with infrastructure as code at the moment is support on the Microsoft stack. Yes, the tools will run on Windows but they are probably only about 50% of the way there. Azure is a different story though due to the API access inherent in the Azure ecosystem.

N-tier applications (especially across different platforms) make the the coding exponentially more difficult.
New tools require new skills and skills in the market are currently limited.

Cloud
Cloud has driven the take up of infrastructure as code (even though the history of infrastructure as code goes back to mid 90’s) as the cloud providers have provided RESTful API’s to access the services to create manage and delete machines instances on their infrastructure as there is no direct access to their data centres. As this has become the norm in cloud delivery it is understandable that people have wondered whether this is possible on their own infrastructure or managed services.

Devops vs. Infrastructure as code
Devops and infrastructure as code are not the same thing. Infrastructure as code helps devops but devops is not encompassed by infrastructure as code. My view of the difference is that devops ops is a process, people and cultural change where as infrastructure as code is a set of tools and techniques. It is perfectly possible to do infrastructure as code without devops but it is much more difficult to do devops without embracing infrastructure as code.

What do you need?
Infrastructure as code needs a tool chain, process, skills and a willingness to change. We will look at the details in other articles but here is a sample tool chain. It contains the major elements needed to support infrastructure as code and aligns them along the general direction of the process.

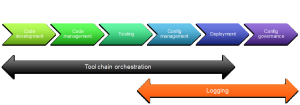
For each of the elements a quick explanation and some of the tools in the element. Be aware that tools have overlapping capabilities.

Code development
At its most basic, a text editor will suffice but there are Eclipse based tools for various DSL’s (domain specific languages) as well as enhanced text editors with plugins for common tools used in infrastructure as code. Many of these will integrate with some of the code management tools available. Visual Studio also has plugins for for DSL’s.
Writing efficient code is still the job of the coder but tools with the plugins will enable syntax checking, code completion etc., though not to the same extent as one of the general coding languages such as C#, Java, Swift etc.
Tools include – vi, emacs, text edit, ultraedit, Eclipse, Visual Studio, and many others

Code management
The choice of code management tool is probably less important than actually having one! A share on a file server is not an effective code management tool! Typically, the choice comes down to what the development team are using and/or whether there is an existing implementation.

Code management tools generally come in 2 flavours client server or peer to peer. Peer to peer seem to be the flavour of the month at the moment and they have some advantages in allowing all ‘developers’ their own access to the entire code tree at once.

Tools include – Subversion, Git, Bitbucket, Visual Studio TFS, Perforce, Bazaar

Testing
Being able to test code is a fundamental part of coding. Test driven development is one technique that cab significantly improve code. This works by defining tests that can be executed by the code based on an input to deliver and expected output. While this may seem a bit redundant when your code says “apache, ensure => installed” there are still good reason to devise some tests. The second is to ensure that the code produces the environment intended and did not have unintended consequences on other parts of the infrastructure. So using configuration management tools to check the before and after state across the environment and ensure that the differences are only the ones intended. This should of course not be done on the production environment but your test and staging environments. It also has the handy feature of allowing back out testing as well, if you choose to do so.

Configuration management
This is the heart of infrastructure as code as majority of execution of the ‘code’ happens here. The configuration management tools are not your CMDB though and are usually based around a client server model. A central server holds the current or available configurations and the client pulls down the appropriate configuration to the instance to be configured and the client executes the code.

Tools include – Chef, Puppet, Ansible, SaltStack, RunDeck etc.

Deployment
Deployment can take two forms being the deployment to the instance to be configured and the deployment of code to the configuration management tool. The deployment to the instance to be configured is usually covered by the configuration management tool. The deployment from the code management tool to the configuration management tool is the same problem that developers have in migration code between environments. This is usually covered by orchestration tools.
Tools in the orchestration space include – Vagrant, Jenkins and others

There is a third category coming to the fore and this covers the deployment of complete stacks. The code in this case describes the ‘data centre’ environment and all the pieces to enable the delivery of the environment including the configuration management tools. These usually have their own DSL as well but are newer tools.
Tools in this space include – Terraform, CloudFormation (AWS only), etc.

Configuration governance
Configuration governance involves the use of the configuration management tools to ensure that configuration drift is eliminated and if configuration drift is detected then the approved configuration and be reapplied to returned to on the instance. While to tools can identify the drift, it is up to internal process and governance principles to decide what to do about the drift. This is the key to governance – having clear guidelines and actions to be taken that have been agreed.
The drift usually occurs because of changes implemented that have not gone through the infrastructure as code process i.e. someone has made a change (usually to fix something) that has not amended the configuration in the code and then directly applied.

Tools include – Puppet, Chef, ScriptRock, Qualys etc.

Where to start
With so many choices and decisions to make often starting is one of the hardest areas. The advice is to start small and contained but make your key choices in delivering your tool chain. This is where the cooperation with the developers needs to be factored in, and the shared use of existing or new technology must be considered.

Keeping track of success and benefits will help expand the use on infrastructure as code by demonstrating the benefit and tend ploughing money saved, back into expanding the use of the tools.

Cloud is a good place to start for new implementations as, cloud almost requires the use of infrastructure as code and the cost of tools and implementation can be included in a cloud business case. This is easier to get through a business case process than trying to justify and infrastructure as code project where many of the benefits are intangible and longer term.

Who are the players
Like many trends in the industry recently the infrastructure as code direction has come out of the open source movement and many of the tools have open source versions and a paid version that provide increase capability, guaranteed compatibility and support. There are many blogs, conferences, un-conferences and meetups dedicated to this subject and related subjects.
The big names in infrastructure as code are the usual suspects but these tend to only cover part of the problem space but a significant part. These are the configuration management tools providers being, Puppet, Chef, Ansible, SaltStack.
The traditional infrastructure software vendors are trying to get involved (BMC, CA, IBM, etc.) but there more traditional automation tools tend to be stuck within that eco-system and do not lend themselves well to code management tools, dev/test/stage/prod release cycles. A number of these players have bought new companies that provide tools that better serve this market and are trying to integrate them into their existing product lines.

Puppet and Chef have the same background though Puppet branched off from Chef a while ago. They both work essentially in the same manner with some implementation differences. The main difference is the Chef uses Ruby as its language while Puppet uses its own DSL but the roots in Ruby and JavaScript can be seen.

A further article will discuss the tools in more detail.

What does success look like?
If you are heading down the path of infrastructure as code success can be measured in a number of ways. However, I believe that you are on the way to success when you have the following:

  • Version control is implemented
  • Automated testing
  • Staging environments are generated
  • Architecture for infrastructure as code is well defined
  • Processes are documented and followed

Along with this go measures. These might be aspects such as:

  • Time to deploy
  • Time to build
  • Number of changes (cadence)
  • Peer reviews of code
  • Changes per incident

These measure need to be built into the process not added as an afterthought!

Categories
Blog

Recent DEVOPS Study by Nigel and Puppet Labs

At the DevOps Enterprise Summit in 2014 the community identified several problem areas with enterprise DevOps adoption we wanted more written guidance around, and one of them was around cultural and leadership aspects during transformation. The DevOps movement has been primarily driven by practitioners, which is why we’ve ended up with such success at the practice level. As success and awareness have risen, we’re now seen new challenges and questions around the path to success and applicability for larger organizations. Some have done this very well, others are struggling, and others yet have no idea where to start. In May we assembled a series of working groups together to address these problems, and the Culture/Leadership group decided to focus our efforts on targeting specific subsets of enterprise VPs, CTOs and CIOs who were either facing significant internal skepticism or lacked concrete experience leading companies through a DevOps transformation.

We identified several specific technology leaders who are:
● Curious about DevOps and skeptical about whether it’s applicable to their environment.
● Convinced about DevOps, but facing skepticism from their executive peers and middle managers.
● Aware of DevOps at a high level, has some teams who have led successful initiatives, but are unsure how to take an organization¬wide approach.
● Experiencing pressure from their CEO and/or peers to investigate DevOps without any successful internal initiatives to learn from.

Once we started collaborating, it quickly became obvious that many of us involved in such transformations had had the same conversations over and over again, all focused around demolishing myths and misconceptions. We decided to confront this head on, listing the most common leadership and cultural traps for our target audience, ultimately aiming to provide high-level reassurance and evidence that DevOps practices are generally applicable and plausibly successful in enterprise environments. Our goal is to make it clear to technology leaders that transformation in enterprise environments is both feasible and desirable.

Categories
Blog

Puppet Melbourne Camp – Diaxion a Sponsor

Diaxion is proud to be a sponsor at the up coming Puppet Camp Melbourne.

Details:
November 17 2015
39 S Wharf Promenade South Wharf
Melbourne

Look forward to seeing you there.

Register today!

Categories
Blog

Big Data Introduction

Intro
Big Data has become one of the buzzwords of the last three years or so with Big Banks, Telco’s, Science/Research/Medical, Advertising/Marketing organisations seeming to lead the field in talking up the adoption. So what is Big Data? How is it being used? What’s available to make sense of it? This article will give some sense of what Big Data is and what it can do and what you might need. I will add another article in the future to look at some more specifics around uses and implementation.

What is Big Data?
So, what is Big Data? This is a bit like saying what is cloud! Although we can make some general remarks, there are probably as many definitions of Big Data as there are of cloud. So lets pull together a few and come up with some consensus with my take influencing the outcome. Where did the first use of the term Big Data come from? It seems to be a paper written by NASA (who else) in 1997, talking about the amount of data they were collecting and the problems in storing this data. It is not until 2008 that the term Big Data or “big data” is starting to be used regularly in the press and other articles. In 2013 the Oxford English Dictionary (OED) included “big data” definition in its June quarterly update. There is an excellent article on the history of “big data” on the Forbes site by Gil Press (http://www.forbes.com/sites/gilpress/2013/05/09/a-very-short-history-of-big-data/).

Big Data

To me Big Data is a rather glib term for something that is changing our world. What is happening is the hugely increasing datafication of our world (personally and professionally) and, our increasing ability to analyse that data. The OED describes big data as “data of a very large size, typically to the extent that its manipulation and management present significant logistical challenges.” This is pretty apt, along with this is Wikipedia’s definition “Big data is a broad term for data sets so large or complex that traditional data processing applications are inadequate.” For me Big Data is a set of characteristics that then define the term:

  • Large datasets typically beyond the ability of traditional database software to process effectively
  • Often but not always based on semi or unstructured data
  • Focus of use for analysis and prediction
  • Extraction of value from data (turning it into information)
  • In the enterprise, the change from processing internal data to mining external data
  • I note that the Internet of Things has replaced Big Data at the top of Gartner’s hype cycle and Big Data is sliding into the ’trough of disillusionment’. Data science is now on its way to the top of the hype cycle which represent a more mature approach.

    How is Big Data being used?
    Some industries have been using Big Data long before Big Data as a term existed. A branch of medicine – epidemiology, has been involved in looking at large amounts of data to assess trends and make medical decisions generally in preventative medicine. You can thank epidemiology for the following and others:

  • The incredible decline in child mortality over the last 150 years,
  • The widespread use of vaccine especially polio and measles that are provided by governments based on the effectiveness seen through epidemiology,
  • Public health improvements through sanitation and clean water,
  • Malaria prevention and controls,
  • Tuberculosis control.
  • So those are examples of Big Data improving the lives of people but where has Big Data been used by business to make decisions, improve bottom line and customer satisfaction, etc? Lets take some areas and have a quick look at them.

    Marketing and Advertising
    Google, Yahoo, Facebook etc process massive amounts of clickstream data to deliver targeted ads to consumers and decide, in real time, the best placement for their clients adverts. Since the decision uses both historic and real time information the amount of data to assess and respond on is enormous. This cannot be processed by a relational database and Google, for example, developed their own database – Big Table. This was subsequently commercialised as part of their cloud offering.

    Amazon are another organisation that makes extensive use of Big Data to send you offers that are personalised. They hold all the purchases you have made, the pages you have visited, how long you have visited, time between purchases etc, as well as comparing you to others who have similar profile to you and making the suggestions “people like you like…”.

    The major banks have made strides with marketing on their websites to make you personalised offers while browsing their website or internet banking site. This is based on the financial information they have on you, your purchases via credit cards and where you have been on their sites and where your have come from.

    Customer satisfaction and loyalty
    Retailers, especially those with well trafficked websites are linking your website visits, to your foot traffic in the store, making offers to you in real time including to your mobile when instore. While this might not be quite here yet it is likely coming.

    Sensors and predictive analysis
    A number of manufacturing companies like Otis and others like Union Pacific railroad are using sensors in their equipment generating large amounts of data. This data is analysed using Big Data techniques, From this failures are predicted and then corrected before they actually happen. Union Pacific reduced the number of derailments by 30% using the information and proactively tacking issues.

    Financial Markets
    Analysing trends and making decisions on derived information can have significant impact on trading profitability. Banks trading in financial markets are using market data along with external data (government statistics, weather, etc) in significant quantities to try to gain a small advantage which result in significant profit increases. Being first to a market opportunity can mean millions of dollars. Even intraday trading will be impacted if trades can be made seconds or milliseconds before others see the same opportunity. The intersection of big data and algorithmic trading is likely to show promise but risks as well.

    Government
    Probably less happy about this in some ways but governments are using the broad range of contact and data they have with you to check for things like welfare fraud, tax fraud. They combine large amounts of data across multiple agencies to profile citizens for tax, benefit entitlement etc. This happens regularly so that as circumstances change benefits can be checked and adjusted. The amount of data is quite sizeable across multiple data stores and uses significant data science to extract the right information.

    Non traditional uses
    It is understood that during an overseas crisis, a large cluster was set up to ingest all of Twitter. This was to identify the protagonists and other identities who were for and against the government of certain state. The analysis ran across many languages identifying keywords, sentiment, profile and other factors in semi real time. This enabled a clearer picture of what was happening to make decisions on support for particular groups.

    Big Data tools
    So now we know what Big Data is and what it is being used for, we now need to get a view on the tools and techniques of Big Data. One of the things about Big Data is that on its own it does not really do anything except store and organise data. Many of the tools are focussed on this aspect however, storing and indexing the data is one thing but actually making sense of the data is another. This is where I believe much of the Big Data talk falls down. Analysis and visualisation of the data is where ‘the rubber hits the road’ and business value is generated. This area is often neglected by the hype around Big Data but to me is probably the most interesting due to the need to understand what could be possible and then, how to visualise the desired result effectively.

    First let’s look at the Big Data tools and what they are. The majority of these are open source. Generally the most often mentioned tool is Hadoop.

    Hadoop grew out of a project at Google called Nutch which Google open sourced. Hadoop usually refers to two tools – Hadoop and MapReduce. Hadoop is essentially a large scale file system that allows data to be accessed wherever it is stored. It divides the data up into smaller pieces that can be stored and accessed more easily. MapReduce indexes/executes code on the data but does that by taking the code to the distributed files on nodes and executing on the node rather than brining all the data to a central location and processing it there. The MapReduce capability implements a programming model that can be used to create fault tolerant and distributed analysis applications that take advantage of the Hadoop file system. The programming model takes care of the transport, execution and return of the results. The display of the results etc requires the use of other tools, which can run as Hadoop jobs. There are a number of companies providing commercial implementations of Hadoop including Hortonworks, Cloudera and MapR.

    Apache Spark is similar to Hadoop (MapReduce) but performs operations in memory enabling much higher performance. Spark requires a distributed storage system such as Hadoop or Cassandra but also runs across Amazon S3. Spark has the ability to support SQL with some limitations but makes it easier for RDBMS users to transition.

    Splunk is used for analysing machine generated Big Data. It excels at processing data real time – capturing, indexing and correlating, and finally reporting/visualisation of the results. Spunk is often used to capture small changes in machine data that can lead to the exposition of a larger trend or event. Spunk supports its own ‘search processing’ language. Spunk is often used for machine log analysis for functions such as security, traffic analysis, operations support etc.

    Twitter now Apache Storm is another real time processing framework like Splunk and promotes itself as the realtime version of Hadoop. Twitter acquisition BackType originally developed the system; Twitter moved it to the open source world on the acquisition. Key users of Storm include Twitter, Spotify, Yahoo, Yelp and GroupOn. ‘Locally’, Telstra owned Ooyala (technology behind the Presto TV service) use the system for their analytics. Storm is written in Clojure and implements a directed graph computation. This takes input from a stream/queue, process it and emits another stream. Other processes can read from the stream if they declare they can and this can be repeated. So, this leads to an input queue, a set of process acting on the input data in a internally declared order and, an eventual output. Key to Storm is that the processing never ends unless it is killed (which is what you want in real time system). Storm integrates with many queuing technologies including Amazon Kinesis.

    Cassandra is a distributed database system with emphasis on performance and high availability. It was originally developed by Facebook and used in their messaging platform before Facebook Messenger. Facebook open sourced the software and it is now a top level project in the Apache Foundation. Cassandra supports MapReduce as well as a number of other frameworks and has its own Cassandra Query Language (CQL) which is similar to (but not the same as) SQL. It is a hybrid key-value and columnar (table) database. It has been a popular ’NoSQL’ database with a large number of high profile users including Instagram, Apple, Netflix, Facebook, Nutanix, Reddit and Twitter.

    Analysis tools – selected with a focus on open source

    While Splunk has analysis interface built in, there are large numbers of specific tools to analyse and present the information from Big Data. While isometrical analysis tools have moved to support the Big Data sources. The majority of software is open source and often comes from the scientific community.

    R is an open source programming language for statistical computing and graphing. Its commercial counterparts would be SAS, SPSS and Matlab. R was created at the University of Auckland based on a language called S (the names are so original!). To use R on Big Data one would first process the data with MapReduce or a stream processing framework and then act on the result set with an R program to deliver results in a meaningful way. R’s ability to visualise the data through its graphic capabilities is outstanding. Generally the software is used by end users rather than IT but both can work together. R has a number of IDE’s including its own RStudio and these integrate with enterprise code management tools. The open source nature has made a number of commercial applications (Matlab, SAS, Tableau, etc) provide interfaces to R or the ability to include R resources into their products

    Pentaho is open core software – having both an open source edition and a paid enterprise version with extra features and support. The software provides a layer to interface to a very wide range of Big Data and traditional data sources. Modules of the software above this layer provide the job construction including Hadoop (MapReduce) jobs and pipelining of these jobs and providing the output capabilities.

    The visualisation and analysis market is where I think the next set of battles will be fought. It is all very well to have the ability to process the data but making sense of it and presenting the information in a digestible way isa skill that is currently in short supply.

    The Last Word
    As for any technology article, one should turn to Dilbert for a final word on the subject!
    Gilbert

    Bibliography
    https://en.wikipedia.org/wiki/Big_data
    http://www.forbes.com/sites/gilpress/2014/09/03/12-big-data-definitions-whats-yours/
    http://www.cdc.gov/mmwr/preview/mmwrhtml/mm6024a4.htm
    https://en.wikipedia.org/wiki/Apache_Cassandra
    http://storm.apache.org/
    https://en.wikipedia.org/wiki/Directed_acyclic_graph